Every wall in the market on one screen
Walls mode reads the live order books of hundreds of coins and draws the large resting orders on one map: how far from the price, how big, bid or ask. A wall appears and disappears within about a second.
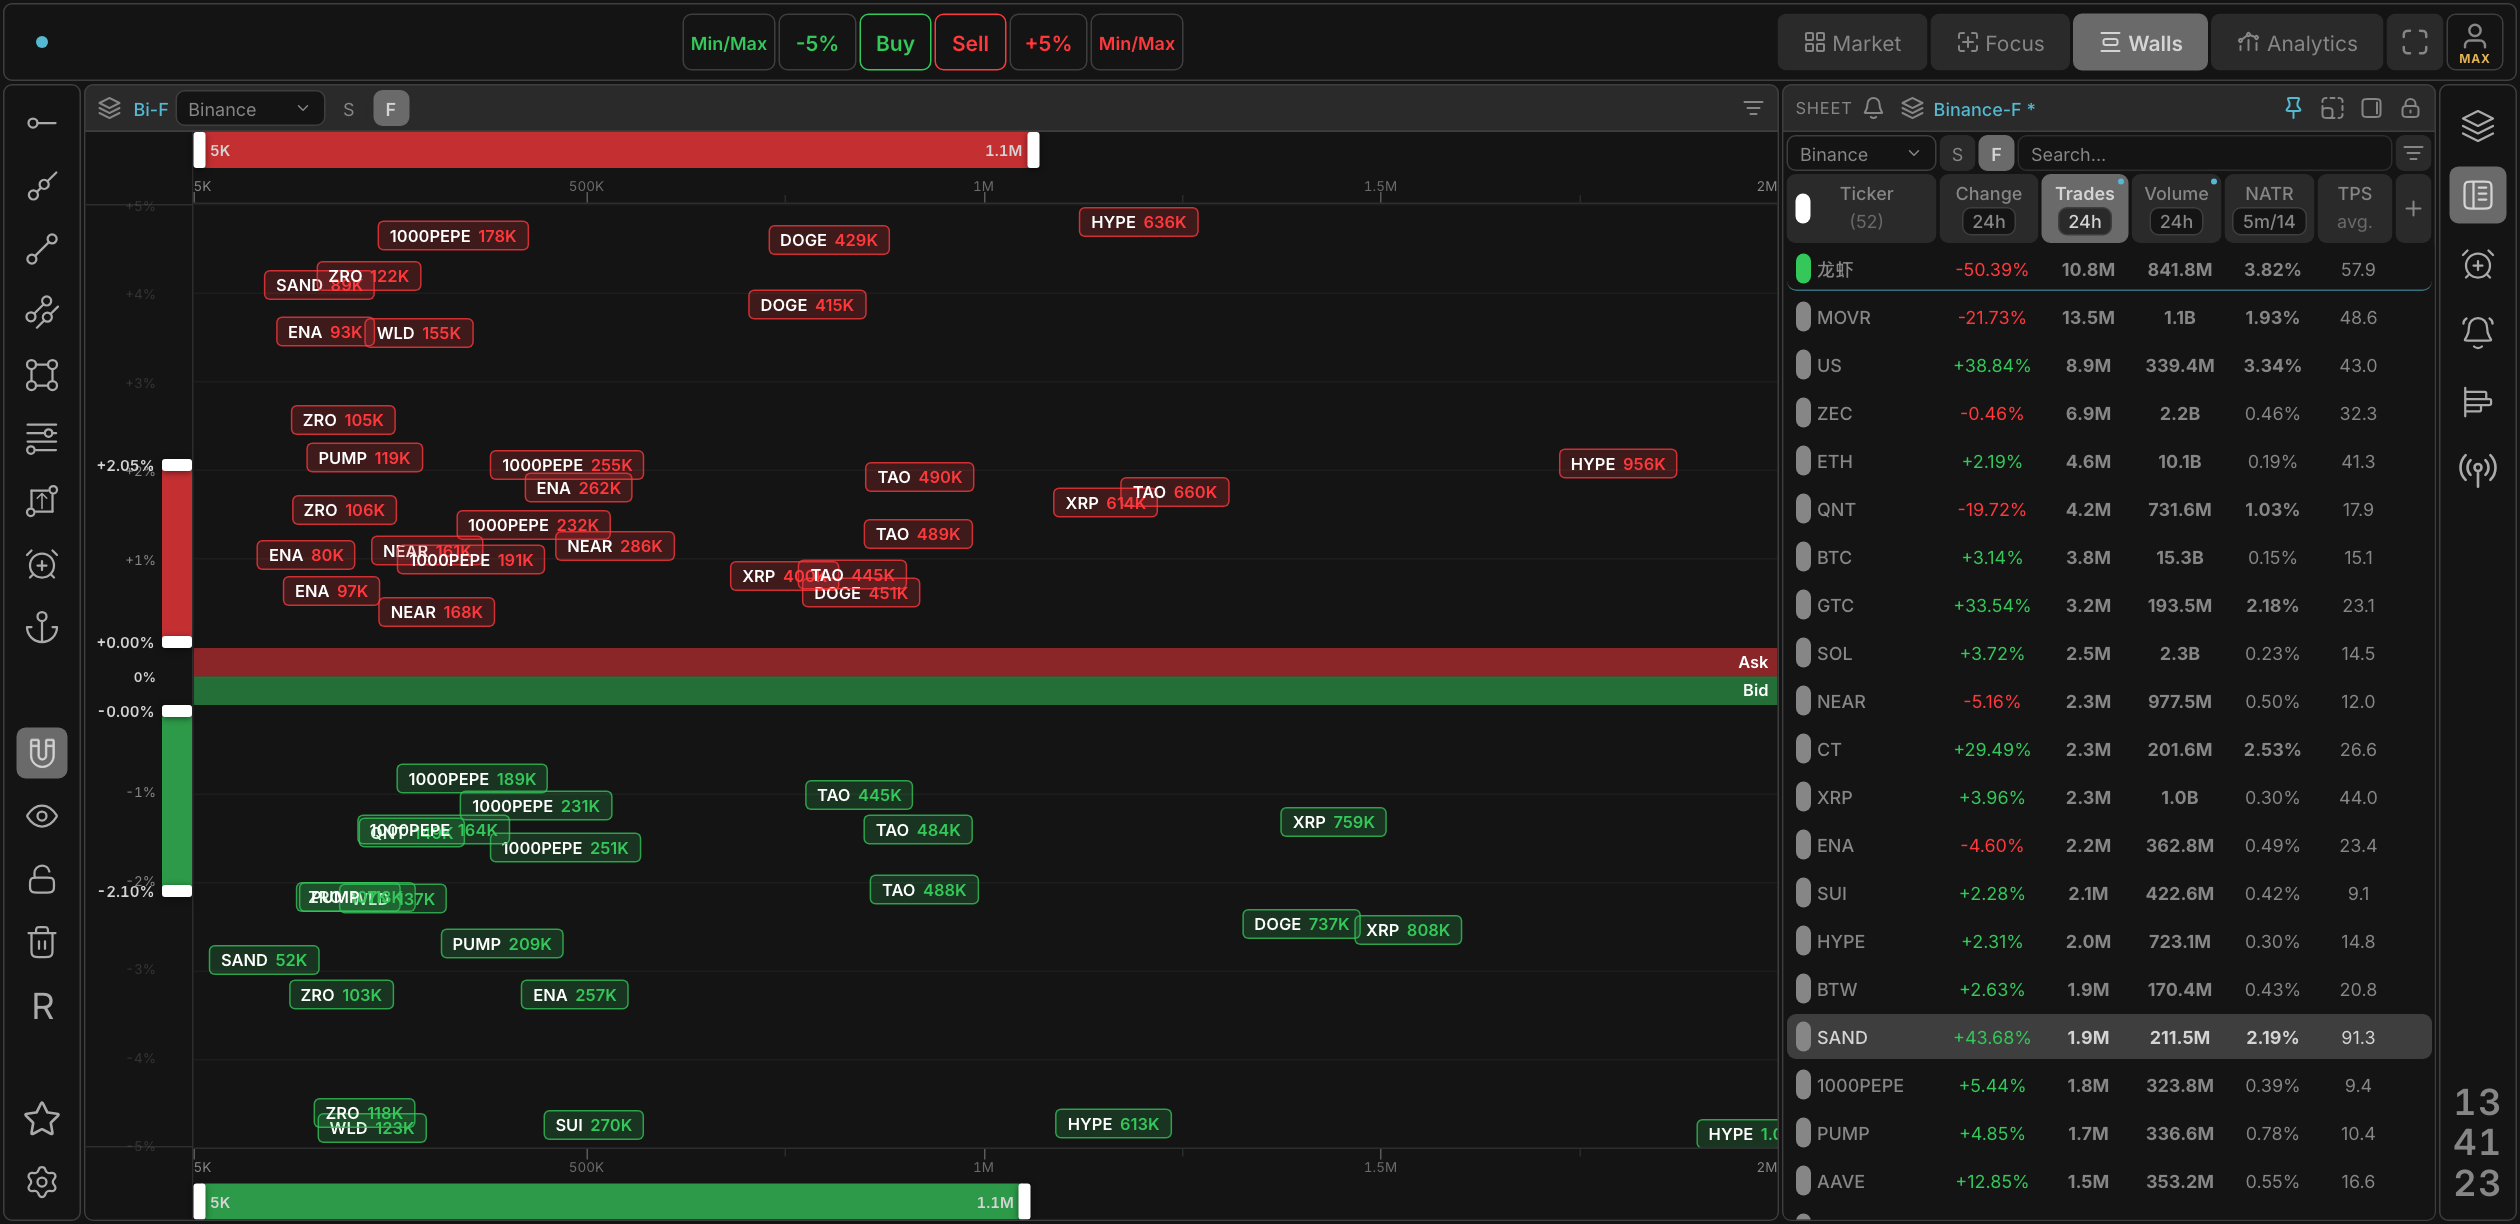
What the map shows
- Vertical: distance to price. Asks above the line, bids below, in percent, so a wall 0.3% away and a wall 4% away read differently at a glance.
- Horizontal: size. The chip's width is the order's size in dollars; thresholds are yours, and a preset keeps a threshold per market.
- Live books, not snapshots. Futures books stream order-by-order; the age of what you see is about a second, measured on each release.
- Futures and spot on the five exchanges, one at a time, switched instantly.
Why a map instead of a single order book
A single-book tool shows you one coin. A screener shows you numbers. The walls map is the part in between: the whole market's resting liquidity at once, so the coin where a wall just landed under the price is the coin you look at next. Click a chip and the coin opens in focus mode with its order book and clusters.
Plans
| Feature | Free | Pro | Max |
|---|---|---|---|
| Saved presets | 1 | 10 | 20 |
| Columns | 1 | 3 | 5 |
| Volume presets | - | yes | yes |
| Pinned coins | - | yes | yes |
Questions
Where does the data come from?
From the exchanges' live order book streams, kept in memory on our servers and served to the browser as deltas. No third-party aggregator in between.
Can I filter by wall size?
Yes. The size threshold, the distance range and the market are part of a preset, and presets sync through your account.