Is the market awake? One curve per exchange answers it
Analytics draws the whole exchange as one line through the day: volatility, volume, trades, funding - the metric you choose, for every coin or the top 50, 100 or 200 by turnover. Today sits on top of yesterday, a week ago and the 7-day median, so you see at a glance whether this hour is normal.
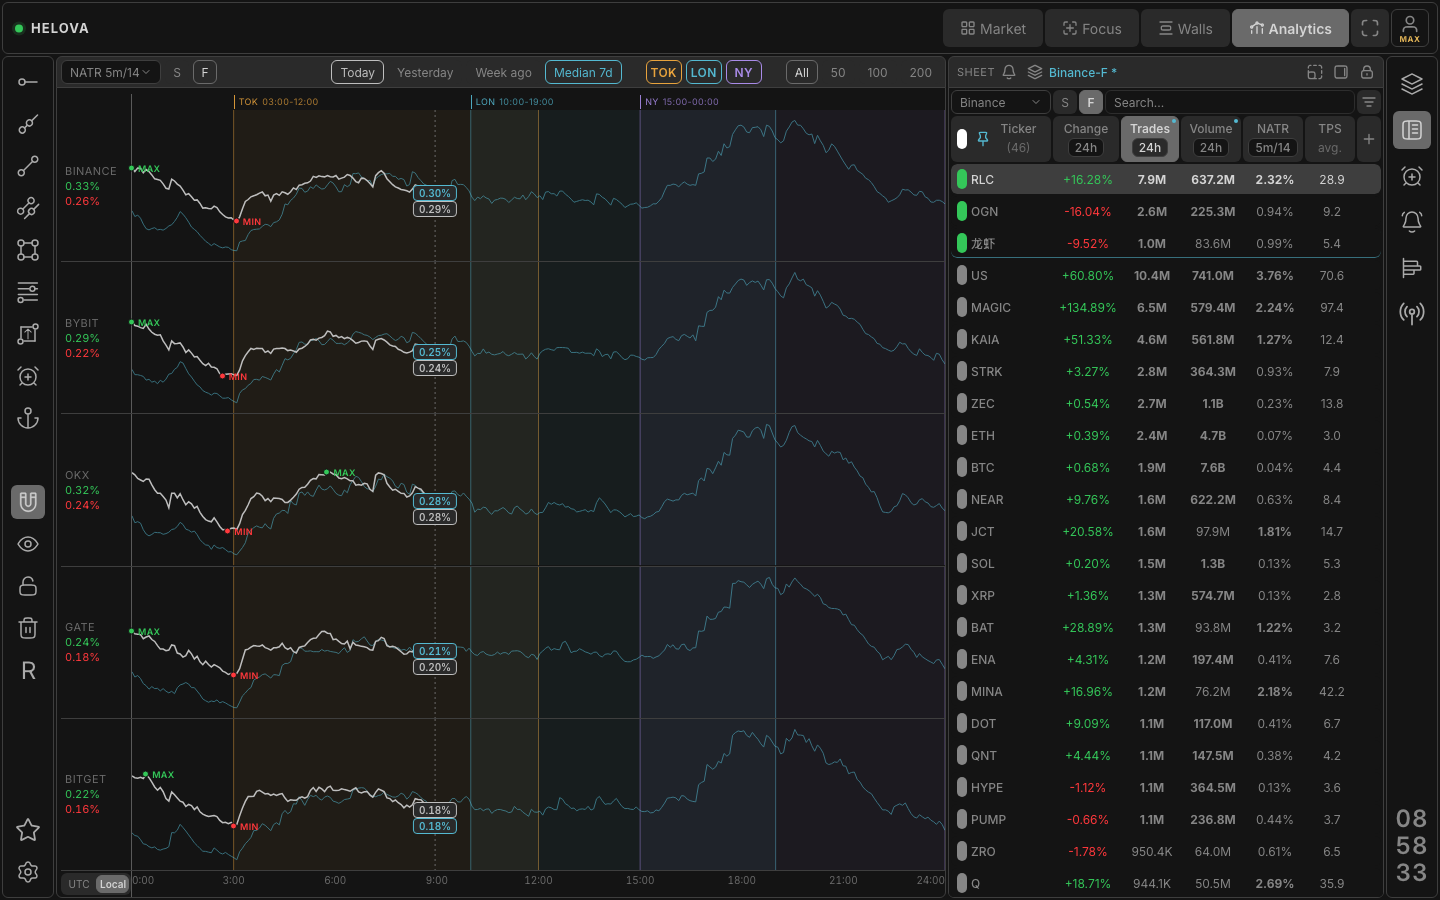
The market as a curve, not a list
Every ten seconds the screener samples the whole sheet of each exchange and records the market-wide value of every column: NATR 5m/14, relative volume, trades per second, change over the timeframes, funding, open interest delta. Analytics draws that record as a day-long curve per exchange, five exchanges one under another.
Today against what is normal
- Yesterday, a week ago, median of 7 days. Overlays on the same axis. A rise above the median is the market waking up; a flat line under it is a day to sit out.
- Sessions. Tokyo, London and New York are shaded on the time axis, in UTC or your local time, so the London open or the New York overlap is read directly off the curve.
- Universe. Every coin of the exchange, or the top 50, 100 or 200 by 24h volume: the long tail and the large caps often move on different clocks.
- Max and min of the day are marked, with the current value and the typical value for this minute side by side.
Why it matters for a screener
A relative-volume alert that fires on a dead Sunday means more than the same alert at the New York open. Analytics gives the baseline: when the whole market is at x3 volume, a single coin at x4 is noise; when the market is flat, it is the signal.
Plans
| Feature | Free | Pro | Max |
|---|---|---|---|
| Exchanges | 1 | all | all |
| Parameters drawn at once | 1 | 5 | all |
| History and 7-day median | today | all | all |
| Coin universes | all coins | all + top 50/100/200 | all + top 50/100/200 |
Questions
Which metrics can be drawn?
Every column of the sheet except market cap: NATR, relative volume, trades per second, volume, change over each timeframe, funding, open interest delta, range and the rest.
How far back does it go?
The recorder keeps the daily curves; the panel shows today, yesterday, a week ago and the median of the last 7 days. Free shows today only.
Is this per coin or per market?
Per market: one value per exchange and timestamp, built from every coin of the chosen universe. For a single coin use the chart.