The whole market on one screen, as charts, not as a table
Market mode puts a grid of live charts next to the sheet. Sort the sheet by volume, relative volume, change or any other column and the grid follows: the first cell is the coin that matters most right now.
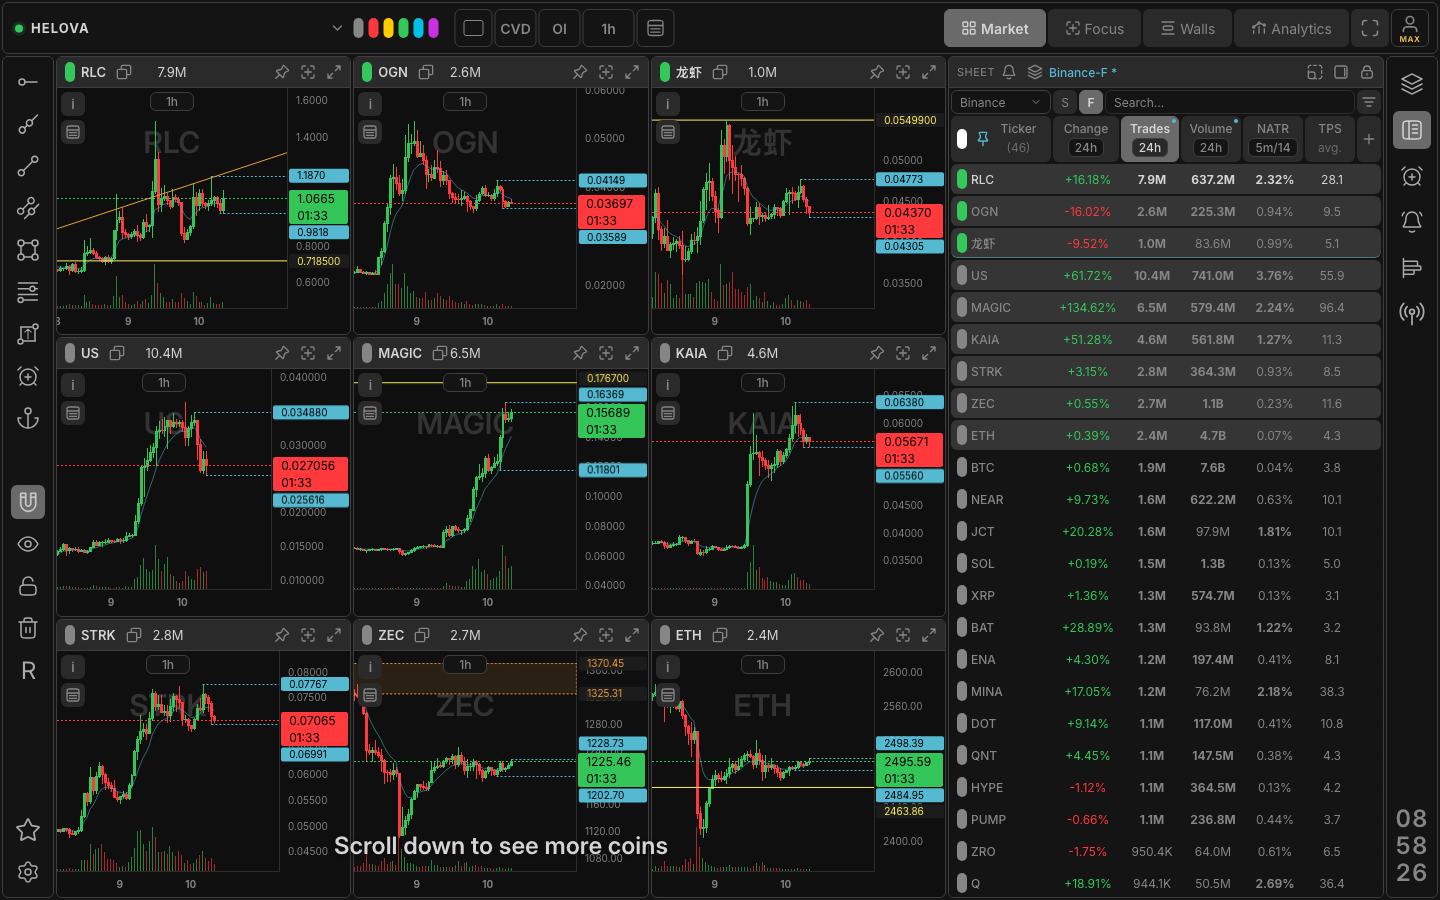
A grid that follows the sheet
The grid is the sheet, drawn as charts. Whatever order the sheet has - 24h volume, trades, relative volume, change over any timeframe, NATR, funding, open interest delta - the grid shows the same coins in the same order. Flag a coin and it pins to the top of both. Scroll the grid and the sheet scrolls with it.
Every cell is a real chart: candles, volume, the forming candle patched with the live price, your drawings and alert lines, and one tap on a cell opens that coin in Focus mode with the same timeframes.
Density you choose
- Grid size. From 2x2 to 7x7: 49 live charts on one screen on the Max plan, 25 on Pro, 9 on Free.
- Timeframes per cell. One chart per coin, or 2 to 4 timeframes of the same coin side by side, so the 5m impulse and the 4h context sit next to each other.
- Candles by count or by width. Set the window as a number of candles or as a fixed bar width in pixels, so a maximised cell keeps the same density instead of stretching.
- CVD and open interest. Cumulative volume delta and open interest toggle on for every chart of the grid at once, in their own panes under the candles.
Built for a scan, not a spreadsheet
A screener table tells you a number; the grid shows the shape behind it. A coin with x20 relative volume looks different when the move is a single wick and when it is a staircase, and that difference is visible in a 150-pixel cell. The grid is where the sheet's sort becomes a decision.
Speed
Charts in the grid are prefetched in the order you will reach them and kept in memory; switching sort, exchange or market draws from that memory first and reconciles with the server in the background. The screener measures its own response time on every release.
Plans
| Feature | Free | Pro | Max |
|---|---|---|---|
| Chart grid, maximum | 3x3 | 5x5 | 7x7 |
| Timeframes per grid cell | 1 | 2 | 4 |
| Flag presets | 5 | 10 | 20 |
| Header metrics, timeframes | 24h only | all | all |
| Exchanges | all | all | all |
Questions
How many charts can I see at once?
Up to 49 (a 7x7 grid) on Max, 25 on Pro and 9 on Free, each one a live chart with volume and, if you switch them on, CVD and open interest.
Does the grid work for spot as well as futures?
Yes. Every exchange - Binance, Bybit, OKX, Gate and Bitget - has a futures and a spot sheet, and the grid follows whichever is open.
Can I keep several timeframes per coin?
Yes, 2 to 4 timeframes per cell on Pro and Max: the same coin on 5m and 4h side by side, for every coin of the grid.
Is the grid live?
Every cell gets the same live candle stream as a single chart: the forming candle moves with the trades, closed candles arrive when they close.